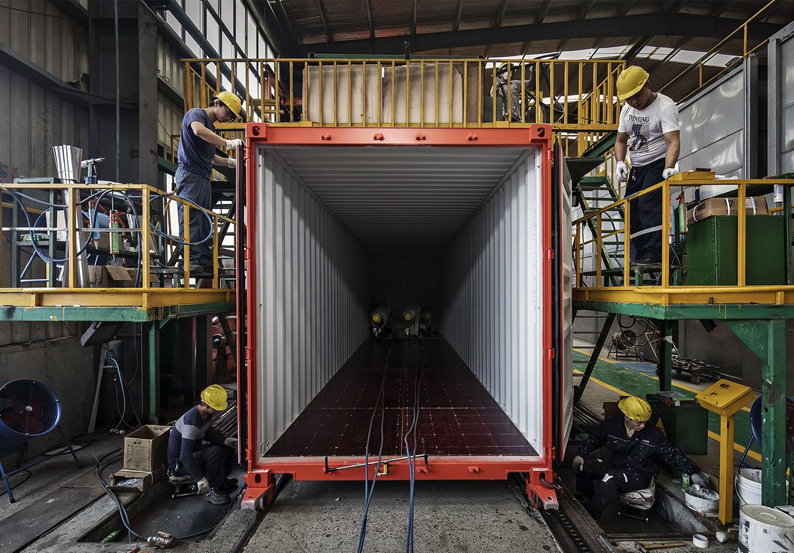
In 2018 most of all containers were manufactured in China
It is noted that, for example, in 1994, China was at the level of 400 thousand TEU, which accounted for 36% of the world market, but over the past 20 years, the PRC has shown stability, reaching 95-96%.
In 2017, only 7.4% of containers produced in China remained in the domestic market, the rest were exported. Among the main buyers in 2018: the United States – 890 thousand units (these are dry refrigerated containers, tank containers), Hong Kong – 680 thousand units, Japan – 395 thousand units, Singapore – 260 thousand units, Denmark – 165 thousand units. Korea and France, 90 thousand units Exports by type of containers at the end of 2017: “dry” containers – 1.9 million units. This is 58%. In terms of refrigerated containers, this indicator was 4.6% (world index – 0.39%), tank containers in China – 0.0195%, world index – 1.75%.